
You should spend about 20 minutes on this task.
The pie chart below shows the main reasons why agricultural land becomes less productive and the table shows how these causes affected three regions of the world during the 1990s.
Summarise the information by selecting and reporting the main features, and make comparisons where relevant.
Write at least 150 words.
Sample: 1:
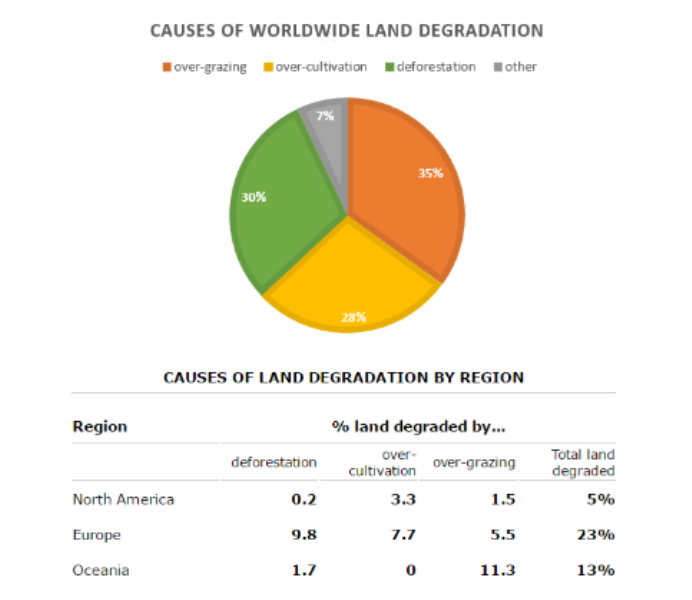
The pie chart illustrates the main reasons for worldwide agricultural land degradation which includes deforestation, over cultivation, over-grazing etc. The table shows how the lands from north America, Europe and Oceania had been affected by these reasons during the 1990s.
From the pie chart we can see that deforestation, over cultivation and over-grazing affected almost equally to worldwide land degradation, each of which contributed about 30%. There were other reasons which had insignificant (7%) contribution in degradation of agricultural land.
From the table it is clear that in 1990, among the three regions, agricultural land in Europe degraded the most because of deforestation, over cultivation and over-grazing which was more than one fifth of the total land. North Amarica’s land was less affected compared to the other regions. Deforestation occurred highly (9.8%) in Europe and North America was insignificantly (0.2%) affected by deforestation.
Over cultivation had degraded Europe’s 7.7% land whereas in Oceania, there was no land degradation due to over cultivation. Over Grazing seemed the main reason for Oceania’s land degradation which contributed 11.3% of the total 13% degraded land. North America was the least affected by over-grazing contributing 1.5% of the total 5% degraded land.
Time: 25 mins:
Feedback score: 7.5
