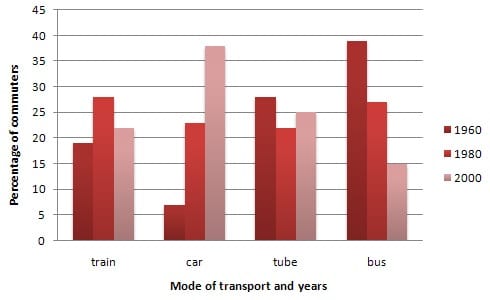
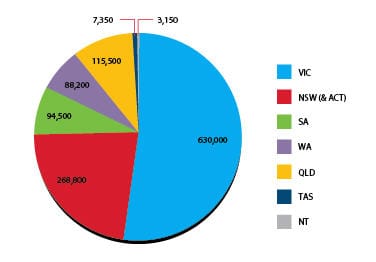
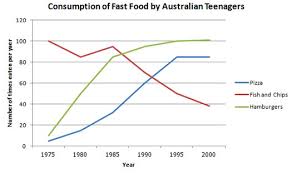
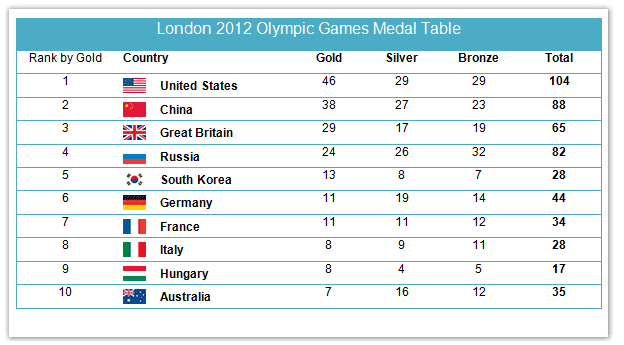
In Writing Task -1, there are 5 kinds of topics i.e Bar Graph, line Graph, Pie Chart, Table and Diagram. In the IELTS Exam only one type of topic may come or it might come combinedly like bar graph or pie chart or line graph or pie chart together. Except Diagram, rest of the 4 can be described more or less similar way. Following some strategies, you can ensure better score in writing Task -1.
Tips-1: Some people consider Writing Task-1 as Writing Task-2, actually that is not true at all. Task-1 is a report like a news in the news paper. We know news in the newspaper never follow any conventional rules like essay writing. The news has no introduction, body or conclusion. In the same way in the writing task-1, there is no introduction, body or conclusion rather it is written like a report in the news paper. On the other hand, writing Task-2, follow the conventional rules of essay writing like introduction, body and conclusion.
Tips-2: In the IELTS Writing Task-, there are some particular vocabularies which are only used to describe graph, charts and diagram, like “Soar “and “rocket” are both very strong words that describe large rises. “Rocket” is more sudden and no need to qualify these verbs with adverbs. “Leap” also shows a large and sudden rise. Here also you need not use qualifying words like adverb.“Climb” is a neutral verb that can be used with the adverbs. Other words like rise, fall, remain unchanged, dramatically increased, sharply declined should be used to describe the trend of the graph or chart.
Tips-3: Except diagram, rest of the 4 kinds of writing task-1 has no introduction, body or conclusion. Pie chart, bar graph, line graph and table follow same rules and order. At first you should write thesis statement, then overview( it is the main idea of the graph. depending on your main idea an examiner gives score on your writing. It should be written in one sentence. If you cannot write it in one sentence, go for two sentence. Here, you will just address key points of the graph specially highest and lowest trends and the exceptional one.
Tips-4: In the body of the graph, you should not write more than 2 paragraph. Before writing the body, just divide the graph or chart into group like higher trend or lower trend or age group or country. After that you should compare the trend within the group and at last you should compare one group with another group.
Tips-5: You should never write conclusion as you know that there are no conclusion in the news. So, just writing your body, you can finish your writing task-1. Remember that you should not write less than 150 words. If you write more than 150 words, there are no problems. How much time you should spend for writing task-1? You will get only 20 minutes for writing task-1 and you need to spend 5 minutes for planning and organizing your task-1. So, rest of the 15 minutes you should spend for your writing. Practice at your home and find out how much you can write on that particular time. It is suggested that it is better if you practice 180 words by 15 minutes. You should also remember that Writing task-1 is less important than writing task-2.


