Task: 1
You should spend about 20 minutes on this task.
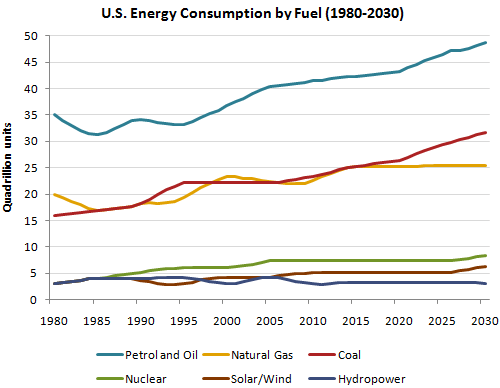
The graph below gives information from Annual Energy Outlook 2008 about consumption of energy in the USA since 1980 with projection until 2030.
Summarize the information by selecting and reporting the main features, and make comparisons where relevant.
Write at least 150 words.
You should spend about 20 minutes on this task.
The graph below gives information from Annual Energy Outlook 2008 about consumption of energy in the USA since 1980 with projection until 2030.
Summarize the information by selecting and reporting the main features, and make comparisons where relevant.
Write at least 150 words.
Task: 1
You should spend about 20 minutes on this task.
The graph below gives information from Annual Energy Outlook 2008 about consumption of energy in the USA since 1980 with projection until 2030.
Summarize the information by selecting and reporting the main features, and make comparisons where relevant.
Write at least 150 words.
Sample: 1:
The line graph delineates a trend about how the six energies were consumed earlier in 1980 and what will be the future consumption of those energies in 2030 in USA.
Overall, Petrol and Oil were the most consumed energy in 1980 and it will continue its supremacy in 2030 whereas even though Nuclear, Solar/Wind power and Hydropower energy started from the same point in 1980, it is Hydropower that will be consumed the lowest in 2030.
To begin with, Petrol and Oil started at a consumption amount of almost 35 quadrillion units and then it experienced an almost continuous growth although having a drop in consumption in the 1980-1985 and 1990-1995 period. Natural gas and Coal, however began with a consumption of 20 and nearly 15 quadrillion units respectively but in the final projection portrays a different scenario where Coal reaching over 30 quadrillion units of consumption and Natural Gas finishing with 25 quadrillion units. Both of them faced random fluctuation over the period and were almost on the same level of consumption for some time during 1985-1995 and again in 2005-2020.
On the other hand,Nuclear, Solar/Wind and Hydropower energy were consumed less than 5 quadrillion units in 1980 but during the five years between 1885 to 1990 Nuclear energy consumption increased and it maintained a stable consumption after that ending with well above 5 quadrillion units in 2030. After 1990 Solar/Wind and Hydropower used to have fluctuations in consumption and finally after some time during 2005-2010 Solar/Wind surpassed Hydropower in consumption and finished with a little more than 5 quadrillion units. Lastly, Hydropower is the least consumed energy in 2030 with less than 5 quadrillion units of consumption. ( 277 words!)
Feedback: score 7.5
Lovely writing. It is ok to write more. However, if you cannot manage time, you should avoid writing more words. Try to summarize the information. Keep it up.
Sample: 2:
The line graph shows how much energy from different sources is consumed by the USA from the year 1980 till date and it also shows prediction up to 2030. The information is collected from Annual Energy Outlook 2008.
Overall, from the graph it is clear that petrol and oil consumption has always been highest in U.S and lowest consumption comes from hydropower energy.
Petrol consumption was the highest consumed fuel in the USA starting with 35 quadrillion in 1980. There was/ were some fluctuations up to year 2005 but after that, the amount of consumption went very high with a sharp upward trend which ended up with 50 quadrillion in 2030.
Natural gas and coal consumption were almost half in comparison of petrol consumption in 1980. Nevertheless, it is clear that the value went up gradually with some fluctuations.
In 1980, energy from three sources including nuclear energy, solar/wind energy and hydropower energy were consumed in lowest amount and approximately up to 7 years, the amount of consumption from these sources remained steady. However, they showed a slightly upward trend with some fluctuations up to year 2007 and then remained steady on different consumption level. Among these three sources, nuclear energy consumption was the highest with about 7.5 quadrillion starting from 2005, amount of solar energy consumed by the USA was 5 quadrillion and solar/wind energy consumption was the lowest in amount. ( 231 words, no need to write much)
Time: 30 mins ( you must write it within 18 minutes)
Task 1 feedback: score 7
- Your writing is quiet good however you forgot to use some words like slightly increased/ decreased/ etc.
- Task 2 is more important than task 1. So you must finish task 1 by 18 minutes. Try to present your ideas within 180 to 190 words to manage time.