IELTS Writing Task -1, Bar Graph
Following some easy steps, You can learn how to describe bar chart. By following these instructions, you can learn the bar chart in a minute!!
Following some easy steps, You can learn how to describe bar chart. By following these instructions, you can learn the bar chart in a minute!!
Topic:
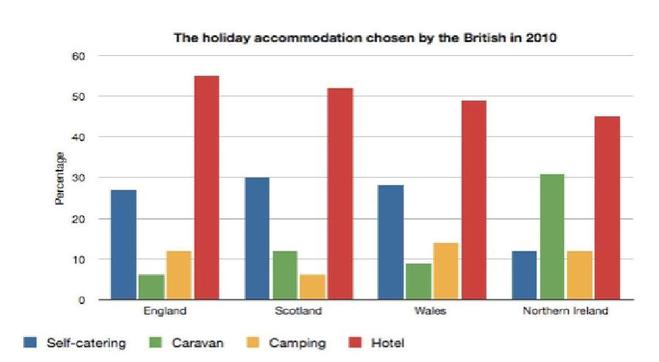
The bar chart below demonstrates the various types of accommodation chosen by the British when they went on holiday in 2010. Summarize the facts by selecting and reporting the main features, and make comparisons where relevant.
The bar chart below demonstrates the various types of accommodation chosen by the British when they went on holiday in 2010. Summarize the facts by selecting and reporting the main features, and make comparisons where relevant.
In the bar graph you should remember following things:
· Link ideas together
· Identify the key points
· Ask yourself which is the biggest/longest
· Think colors and lengths.
· At first Look don’t read.
· Look at the biggest/the smallest
· Look for similar types.
· Notice exceptions
· Look at the chart and think for 3/4 minutes
· Make notes on important matter what you are going to write
In this bar chart you will find
- Hotels (at over 50%) were the most common form of accommodation
- Self-catering((just below 30%) was second most popular with one major exception
- Caravan and camping (around 10%) holidays were typically least popular an exception
- England, Scotland and Wales follow a broadly similar pattern except Scotland
- Caravanning in Northern Ireland is exceptional
How to organize this Bar Chart:
You can write this bar chart more than one way! Either you can choose each type of accommodation or you can state country one by one. So which one will you follow??? You must select the simpler one! In this bar chart, we find that among the 4 countries 3 countries are almost same, though Northern Ireland has similarity but it has little exception!
You should follow some steps to write this chart
- Paraphrase the title of the bar graph
- Write the overview which is considered as the conclusion and this is the main part of this task as your score will be given on the basis of this overview!. Remember on thing that there is no conclusion of the task 1, rather it is like a report or a piece of news. You know that in the news there is no conclusion.
- Then explain the trend or group of the information of the bar graph one by one. You need not write any paragraph. Just describe.
Answer of the Bar Chart:
This bar chart illustrates the holiday accommodation selected by people in the UK in 2010.
Overall, it is possible to say that the English, Scottish, Northern and Welsh had very similar choices and hotels were the most popular type of accommodation.
In all four countries, around 50% people selected to stay in hotels. This percentage was highest in England with around 55%, which was two times more than the number of people (27%) who cooked for themselves and greater than the number of people(12%) who stayed in campsites.
The same pattern was found for the Scots and the Welsh. In each case, around 50% of holidaymakers took the hotels as their accommodation and with around 30% people went for self-catering apartments. The one exception was caravan holidays at 12%, which was more popular than camping holidays in Scotland. On the other hand, the opposite pattern was found in the Wales.
But the one country Northern Ireland shows a different pattern. In this country, over 30% of the people chose caravan which was more popular than self-catering accommodation and camping (both around 12%).


