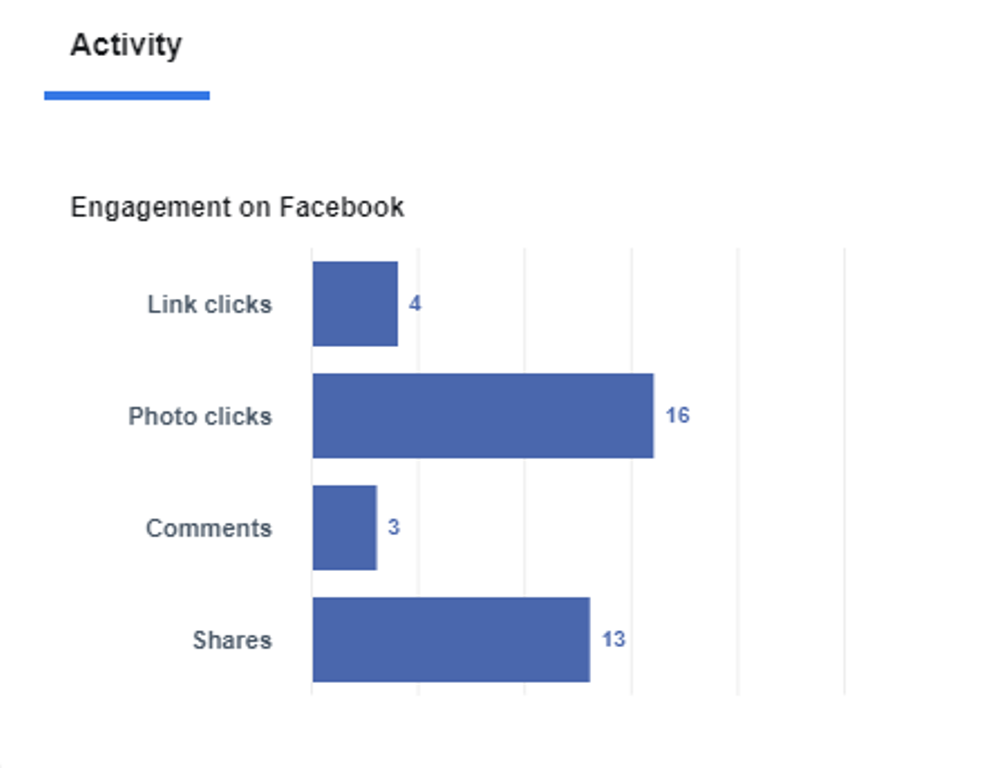
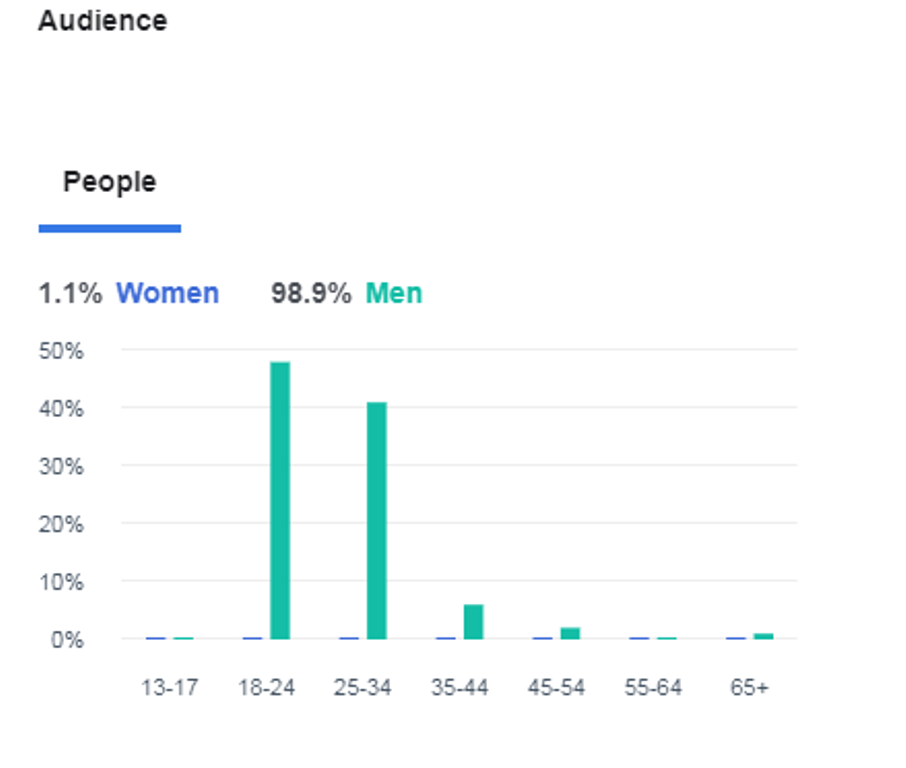
The Bar charts show the activity on the face book advertisement and the men and women who visited the particular advertisement in 2018.
Summarize the information and make comparison where it is necessary.
Summarize the information and make comparison where it is necessary.
The Bar charts illustrate the activity on the face book advertisement and the men and women who were engaged with the certain advertisement in 2018. First chart shows the activity of the audience and the second chart shows the percentage of men and women who visited the advertisement. The amount has been shown in percentage.
Overall, it can be said that in the case of face book engagement, Photo click was the highest and Comment was the lowest. In another chart, most of the visitor of the advertisement was men.
In the activity chart it is found that the audience engaged on the face book by four different ways i.e., Link clicks, Photo Clicks, comments and Shares. Photo clicks were done by the 16 people that was the highest in number and with 3 people, comments were the lowest. The advertisement was shared by the 13 people. On the other hand, links were clicked only by the 4 persons.
In the case of audience, most of the visitors were men with age group 18-24 and 25-34 respectively and the percentages was 98.9%. Only an insignificant amount of women visited the advertisement which was only 1.1%. Rest of the age group categories went below 5%.
----------------------------------------------------------------------
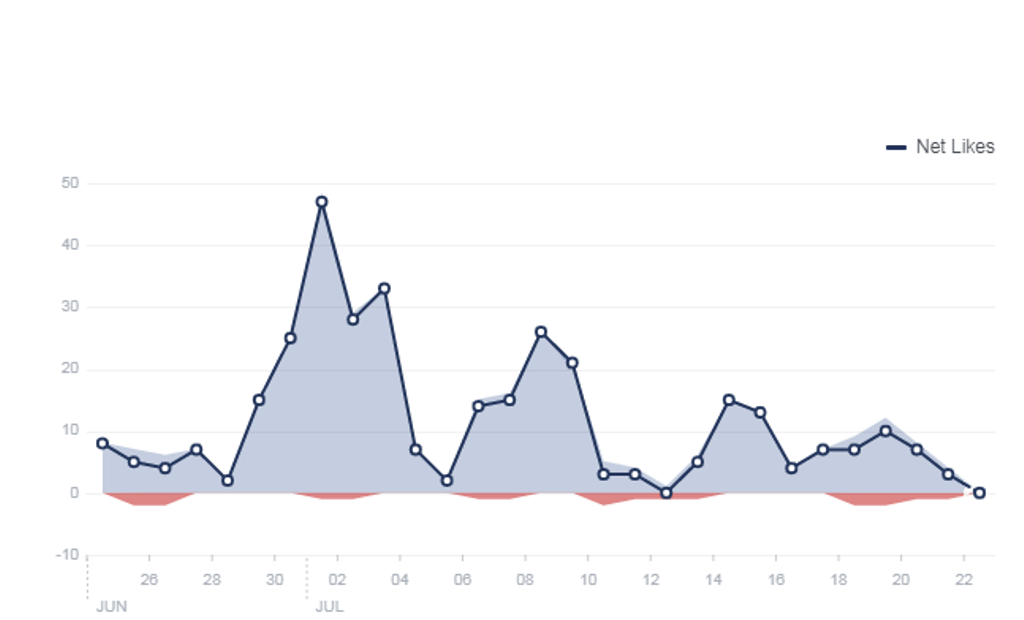
The line graph shows that the particular face book page likes happened between 26th June 2019 to 22nd July 2019 from the various sources.
Summarize the information and make comparison where necessary.
Summarize the information and make comparison where necessary.
The line graph presents the certain face book page likes which occurred between 26th June 2019 to 22nd July 2019 from the a variety of source over 28 days. The amount has been shown in numbers.
Overall, it can be said that over 28 days highest page like occurred on 1st July 2019 and the lowest page likes took place on 22nd July.
At the beginning, on the 26th June less than 10 people liked the page and on 29th June it was slightly decreased. However, from 29th June page like rocketed to about 50, but after 1 day it slightly decreased to 28 and again increased to 35 on 4th July. The fall of the page like continued till 6th July and declined to only an insignificant number (1).
From 6th July, with some fluctuations, it gradually increased to one quarter (25). But again from 9th July it decreased to 0. Then again after 12th July the page like slightly increased and reached to 15. With some fluctuation at the end of the 22nd July it again got 0 like.


