IELTS Writing Task- 1- Table:
Topic:
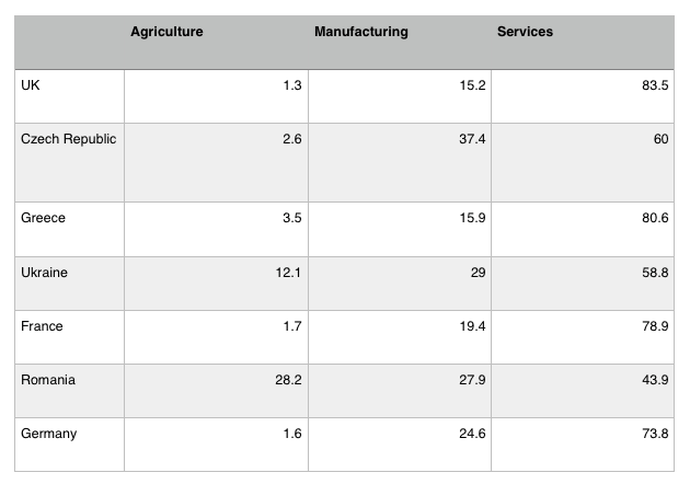
This table shows the percentage of the population working in the agricultural, manufacturing and service sectors in 7 European countries in 2014.
The table:
·Look at the bigger figure
·Group information together
·Find the similar patterns in the information
·Organize those patterns into paragraphs
An easy way to group the information is just to write about agriculture, then manufacturing and then services. It is not enough just to list all the information. You should analyze those figures and find some patterns to avoid repetition.
Look at the variation from the biggest to the smallest:
Agriculture = 1% (almost nothing) to 30% = huge variation
Manufacturing = 15% to around 40% = significant
Services = 44% to 84% = almost same range
Now link the information together and compare between the different sectors. Following 4 steps you should write this like all other graphs and charts. First, paraphrase the topic, then write overall idea like a summary after that give detail description by 2 to 3 para.
A better version:
This table demonstrates the percentage of the population employed in the agricultural, manufacturing and service areas in 7 European countries in 2014.
Overall, It is straightaway obvious that in each case the highest proportion of people were employed in the service sector and with one exception, the lowest number of people were employed in the agriculture sectors.
The table shows the huge variation in the agricultural sectors. In Romania and Ukraine around 30% and 13% of the respective workforces worked in agricultural sectors, while in all the other countries except this figure was 3.5% or lower.
There was less obvious variation in the manufacturing sector with the percentages fluctuating from a high of 37.4% in the Czech Republic down to about 15% in the UK and Greece.
There was roughly the identical distinction in the service sector. The Greece, UK, France and Germany all had around three quarters of the labor force employed in the service industry. By contrast, around 60% of Czech & Ukrainian workers and less than 45% of Romanian workers were engaged in the service sectors.
It is notable that people from UK, France, Germany and Greece all had a very low percentage of people worked in agriculture and a very high amount in services. In contrast, the Czech Republic, Ukraine and Romania all had a significant percentage of workers either in manufacturing or agricultural sectors.


