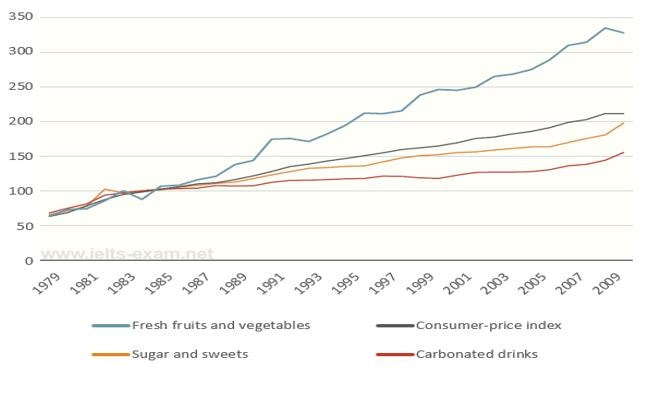
The graph below shows relative price changes for fresh fruits and vegetables, sugars and sweets, and carbonated drinks between 1978 and 2009.
Summarise the information by selecting and reporting the main features, and make comparisons where relevant.
Write at least 150 words.
The line graph represents a comparative change in price among food items like fresh fruits and vegetables, sugar and sweets and carbonated drinks over the span of 30 years from 1979 to 2009. Overall, all the food items began from the same price point in 1979 but the price of fresh fruit and vegetables experienced the highest growth during the period whereas the price of carbonated drinks was the lowest among all.
Firstly, after beginning from just above 50 taka, the price of fresh fruit and vegetables reached 100 taka in 1983. It then experienced a sudden fall in price between 1983-1985 and after that it surpassed all other foods’ price. In 2009, it reached over 300 taka after having random fluctuations and staying well above the consumer price index.
On the other hand,the price of suger and sweets as well as carbonated drinks stayed with that of fresh fruits and vegetables till 1985. After that both of them fall under the consumer price index but steadily increased to the end of the period. Finally, Sugerand sweet and carbonated finished with a price of nearly 200 and just above 150 taka respectively which was below the consumer price index.
Feedback score: 7.5
Sample: 2
The line graph presents how the price of fresh fruits and vegetables, sugars and sweets, and carbonated drinks changed over 40 years time period starting from 1978 to 2009.
From the graph it is clear that prices of each of these foods followed an upward trend over this mentioned time period. Initially, price of fresh fruits and vegetables, sugars and sweets, and carbonated drinks were almost same in 1978. But prices of these products went up gradually as the time increased. Fresh fruits and vegetables became the most costly product among the above mentioned products and followed an upward trend with some fluctuations.
Furthermore, price of sweet products and drinks also followed an increasing pattern with less fluctuation compared to that of fresh fruits and vegetables. However, price of carbonated drinks
did not change much from the year 1990 to 2000. After being almost a fixed price for a decade, the price began to increase. The consumer price index also followed an upward trend over four decades.
Time: 23 min
Feedback score: 8/ nice


